
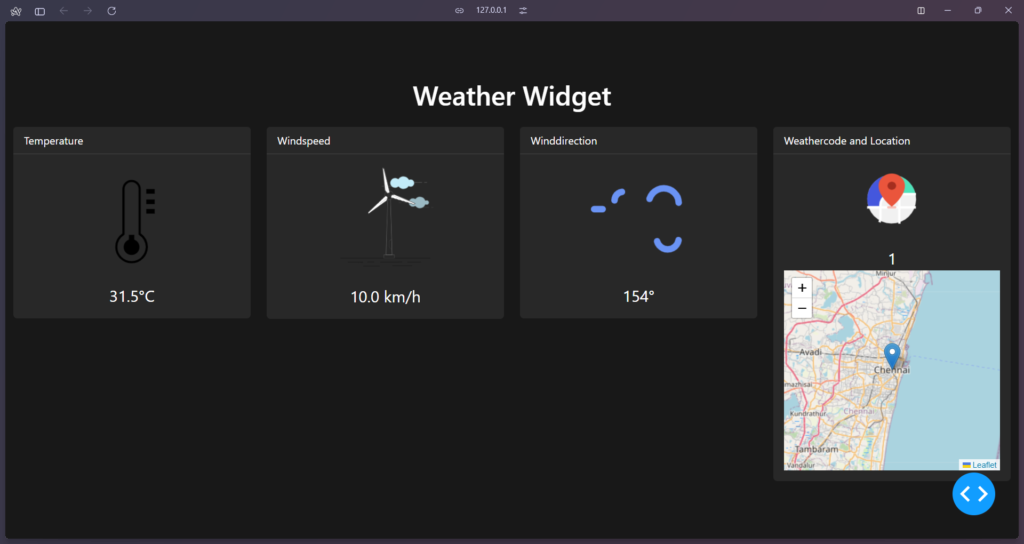
In today’s blog, we’ll dive into creating a dynamic weather widget using Python’s Dash framework. This widget will fetch live weather data and display it alongside engaging animations, providing a visually appealing and informative user experience.
Prerequisites
Before we begin, make sure you have Python installed on your system. You’ll also need to install Dash and other necessary libraries using pip:
pip install dash dash-bootstrap-components requests dash-extensions dash-leaflet
Setting Up the Project
Let’s start by importing the required libraries and setting up our Dash application.
import dash import dash_bootstrap_components as dbc from dash import html, dcc import requests from dash.dependencies import Input, Output from dash_extensions import Lottie # For animations import dash_leaflet as dl # For the map
Next, initialize the Dash app and include Bootstrap CSS for styling:
app = dash.Dash(__name__, external_stylesheets=[dbc.themes.BOOTSTRAP])
Fetching Live Weather Data
To fetch live weather data, we’ll use an API provided by Open Meteo:
def get_weather():
    url = "https://api.open-meteo.com/v1/forecast"
    params = {"latitude": 13.0827, "longitude": 80.2707, "current_weather": True}
    response = requests.get(url, params=params)
    weather_data = response.json()

    if "current_weather" in weather_data:
        current_weather = weather_data["current_weather"]

        temperature = current_weather["temperature"]
        windspeed = current_weather["windspeed"]
        winddirection = current_weather["winddirection"]
        weather_code = current_weather["weathercode"]

        weather_info = {
            "Temperature": f"{temperature}°C",
            "Windspeed": f"{windspeed} km/h",
            "Winddirection": f"{winddirection}°",
            "Weathercode": weather_code,
        }
        return weather_info
    else:
        return None
Building the User Interface
Now, let’s construct the layout of our Dash application. We’ll use Bootstrap components for structuring and styling our weather widget
.app.layout = html.Div(
[ html.Script( src="https://unpkg.com/@dotlottie/player-component@latest/dist/dotlottie-player.mjs",
type="module",
),
dbc.Container(
[
dbc.Row(
dbc.Col(
html.H1("Weather Widget", className="text-center my-4"),
width=12,
),
justify="center",
),
dbc.Row(
[
# Temperature card
dbc.Col(
dbc.Card(
[
dbc.CardHeader("Temperature"),
dbc.CardBody(
[
html.Div(
Lottie(
options=dict(
loop=True, autoplay=True
),
width="50%",
height="50%",
url=weather_icons["temperature"],
),
),
html.Div(
id="temperature", className="value"
),
]
),
],
className="card mb-4",
),
width=3,
),
# Windspeed card
dbc.Col(
dbc.Card(
[
dbc.CardHeader("Windspeed"),
dbc.CardBody(
[
html.Div(
Lottie(
options=dict(
loop=True, autoplay=True
),
width="50%",
height="50%",
url=weather_icons["windspeed"],
),
),
html.Div(id="windspeed", className="value"),
]
),
],
className="card mb-4",
),
width=3,
),
# Winddirection card
dbc.Col(
dbc.Card(
[
dbc.CardHeader("Winddirection"),
dbc.CardBody(
[
html.Div(
Lottie(
options=dict(
loop=True, autoplay=True
),
width="50%",
height="50%",
url=weather_icons["winddirection"],
),
),
html.Div(
id="winddirection", className="value"
),
]
),
],
className="card mb-4",
),
width=3,
),
# Weathercode and Map card
dbc.Col(
dbc.Card(
[
dbc.CardHeader("Weathercode and Location"),
dbc.CardBody(
[
html.Div(
Lottie(
options=dict(
loop=True, autoplay=True
),
width="50%",
height="50%",
url=weather_icons["weathercode"],
),
),
html.Div(
id="weathercode", className="value"
),
dl.Map(
style={
"width": "100%",
"height": "300px",
},
center=[13.0827, 80.2707],
zoom=10,
children=[
dl.TileLayer(),
dl.Marker(
position=[13.0827, 80.2707],
children=[
dl.Tooltip(
"Chennai, India"
),
dl.Popup(
[
html.H1("Chennai"),
html.P(
"Weather data location."
),
]
),
],
),
],
),
]
),
],
className="card mb-4",
),
width=3,
),
],
justify="center",
),
dcc.Interval(
id="interval-component", interval=60000, n_intervals=0
), # Update every 60 seconds
],
fluid=True,
className="bg-dark text-white", # Dark mode styling
),
],
className="full-page",
)
Live Updates with Callbacks:
To ensure the weather information updates dynamically, we’ll set up a callback function that updates the data every minute (dcc.Interval).
@app.callback(
    [
        Output("temperature", "children"),
        Output("windspeed", "children"),
        Output("winddirection", "children"),
        Output("weathercode", "children"),
    ],
    Input("interval-component", "n_intervals"),
)
def update_weather(n):
    weather_info = get_weather()

    if weather_info is None:
        return ["Data not available!"] * 4

    return [
        weather_info["Temperature"],
        weather_info["Windspeed"],
        weather_info["Winddirection"],
        weather_info["Weathercode"],
    ]
Styling with CSS
Lastly, we’ll add custom CSS to style our application, ensuring it looks sleek and professional.
body {
  margin: 0;
  padding: 0;
  height: 100%;
  background: url('https://lottie.host/embed/710935a8-5df6-4baf-8461-b9dbf1cc35e0/Bw1LlmZoFA.json') no-repeat center center fixed;
  background-color: #181818;
  color: white;
}

.full-page {
  display: flex;
  flex-direction: column;
  justify-content: center;
  align-items: center;
  height: 100vh;
}

.card {
  background-color: #282828;
  border: none;
  color: white;
}

.card-header {
  background-color: #282828;
  border-bottom: 1px solid #444;
}

.card-body {
  display: flex;
  flex-direction: column;
  align-items: center;
}

.value {
  font-size: 1.5rem;
  margin-top: 1rem;
}

.bg-dark {
  background-color: #181818 !important;
}
Conclusion
In this blog, we’ve walked through the process of creating a weather widget using Dash and Python. By leveraging APIs for weather data and integrating dynamic updates with Dash’s callback functions, we’ve created a responsive and visually appealing application. Feel free to customize the widget further or explore additional features to enhance its functionality!
Chakilam Satya Lohit
Customer Success Manager
Toolfe – IT & Process Automation